
According to Oxford Languages, a Data Scientist is “a person employed to analyze and interpret complex digital data, such as the usage statistics of a website, especially in order to assist a business in its decision-making.” In 2016, Glassdoor asserted that being a Data Scientist was the best job in America. Last year, Data Scientist ranked as the number three job for 2020 by Glassdoor, and it’s only surpassed by Java Developer and Front End Engineer.
According to Udacity, top 8 skills for Data Scientists are:
#1. Math and Statistics.
#2. Analytics and Modeling.
#3. Machine Learning Methods.
#4. Programming.
#5. Data Visualization.
#6. Intellectual Curiosity.
#7. Communication.
#8. Business Acumen.
As a data science practitioner in Malaysia, I am interested to find out the skills and trends that are most sought in the industry right now. I do understand the fact that most companies look for an applicant who fits their vacancy and also has the skill set in the technologies they are looking for. This will definitely save time and money for the company instead of providing the training again.
In this article, I will try to find answers to a few important questions, which every data science jobseeker will have in mind, such as below:
1. What are the top skills companies are looking for?
2. What are the top tools companies are looking for?
3. What are the companies that are actively offering jobs in this field?
4. What are the locations that have more openings?
To investigate the above research questions, we will perform an analysis from the recent (21 September 2021) advertised Data Scientist jobs, extracted from job portal using web scraping. The tasks for the analysis can be grouped into several main tasks:
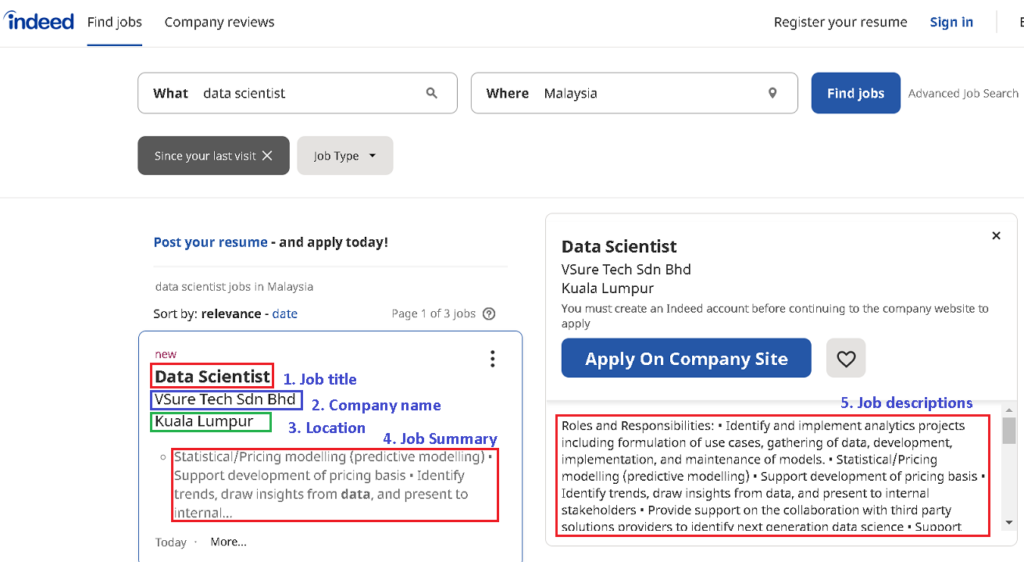
(1) Web scraping of Job Portal (Indeed)
I have gathered all the relevant job information (job title, company name, location, job summary and descriptions) from the main job portal in Malaysia (Indeed) which almost every jobseeker and recruiter uses these days. I used BeautifulSoap (Python library) for web scraping, since the traditional approach works well with the portal website.
The main Python libraries used are BeautifulSoup, Requests (simple HTTP library for Python) and NLTK (text processing libraries for tokenization, parsing, classification, stemming, tagging and semantic reasoning).
# installing required libraries
!pip install bs4
!pip install requests
!pip install nltk==3.6.2
We import main libraries including Pandas (open source data analysis and manipulation tool) to handle data frame for data processing.
import nltk
import pandas as pd

from datetime import datetime
import requests
from bs4 import BeautifulSoup
import sys, time

print('The Python version is {}.'.format(sys.version_info))
print('The nltk version is {}.'.format(nltk.__version__))
Scrape Indeed Malaysia job portal using “data scientist” keyword.
# prepare the link
def get_url(position , location):
  template = 'https://malaysia.indeed.com/jobs?q={}&l={}'
  url = template.format(position, location)
  return url

# get jobs records from html tags using BeautifulSoup library
def get_record(card):
  job_title= card.find('span' , {'title': True}).text.strip()
  company_name = card.find('span' , {'class':'companyName'}).text.strip()
  company_location = card.find('div' , {'class':'companyLocation'}).text.strip()
  job_summary = card.find('div' , {'class':'job-snippet'}).text.strip()
  job_link = 'https://malaysia.indeed.com'+card.get('href')
  try: # try get a salary if exists
    job_salary = card.find('span' , {'class':'salary-snippet'}).text.strip()
  except AttributeError:
    job_salary = ''
  try: # try get a job desriptions if exists
    job_desc = ''
    # creating request object
    req = requests.get(job_link)
    # creating soup object
    data = BeautifulSoup(req.text, 'html')
    # finding all li tags in ul and save the text within it (job descriptions)
    data1 = data.find('ul')
    for li in data1.find_all("li"):
        job_desc = job_desc + li.text
  except AttributeError:
    job_desc = ''
  # create job records to be save later
  record = (job_title,company_name,company_location,job_summary,job_salary, job_link,job_desc)

  return record

def jobsearch(position,location):
  records = []
  print("Job search:", position)
  print("Job location:", location)
  url = get_url(position, location)

  while True:
      response = requests.get(url)
      soup = BeautifulSoup(response.text,'html.parser')
      cards = soup.find_all('a' , {'data-hide-spinner':"true"})
      for card in cards:
        record = get_record(card)
        #print(record)
        records.append(record)
        #print(len(records))
      try:
        url = 'https://malaysia.indeed.com'+ soup.find('a', {'aria-label':'Next'}).get('href')
      except AttributeError:
        break

  # create pandas dataframe to save search job results
  indeed_data = pd.DataFrame(columns=['job_title','company_name','company_location','job_summary','job_salary','job_link','job_desc'])
  for x in records:
    j_title = x[0]
    j_cn = x[1]
    j_cl = x[2]
    j_s = x[3]
    j_sal = x[4]
    j_l = x[5]
    j_dsp = x[6]
    indeed_data = indeed_data.append({"job_title":j_title, "company_name":j_cn, "company_location":j_cl, "job_summary":j_s, "job_salary":j_sal, "job_link":j_l, "job_desc":j_dsp}, ignore_index=True)

  # export pandas dataframe into excel
  indeed_data.to_excel('jobsData.xlsx')
  print('DataFrame is written to Excel File successfully.')

  return indeed_data

# search "data scientist" jobs in Malaysia
df_data = jobsearch('data scientist', 'Malaysia')
We obtained about 191 job results from the portal website.
# print a sample of data frame
df_data.head()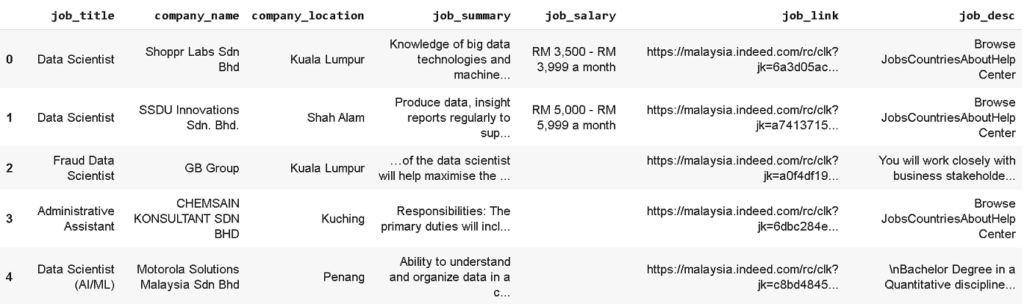
We can observe from a sample data above that some job results title may not relevant to data scientist job (index data no. 3 shows ‘Administrative Assistant’). We can use Pandas data filter method to obtain only title with includes ‘Data Scientist’ string. From a total of 191 job results, we managed to get around 54 data scientist jobs for further analysis.
# Only titles specifically contains Data Scientist will be considered
df_data_scientist = df_data[df_data['job_title'].str.contains('Data Scientist')]
df_data_scientist.shape
(2) Text Pre-processing of Raw Data
Next, we need to perform some text pre-processing task to clean data for the ‘job descriptions’ data column. This is because the string contains unusual text and symbols that need to be cleaned so that NLTK library can grasp it. The task includes main pre-processing techniques like normalization, tokenization and annotation.
# Clean the data for job desriptions column
nltk.download('stopwords')
from nltk.corpus import stopwords

stop_words = stopwords.words('english')
requirements = df_data_scientist['job_desc']
requirements_token = requirements.str.replace(', ', ' ').str.replace('; ', ' ').str.replace('\n', ' ').str.replace('/', ' ').str.lower().str.split()
requirements_clean = requirements_token.apply(lambda x: [w for w in x if w not in stop_words])(3) Data Modeling using NLP Tools
For a quick analysis, we can create a Word Cloud to highlight popular words and phrases based on frequency and relevance. They can provide us with quick and simple visual insights that can lead to more in-depth analyses.
# Find the most frequent words
unique_words = {}
for element in requirements_clean:
    for word in element:
        if word not in unique_words:
            unique_words[word] = 1
        else:
            unique_words[word] += 1

# Generate WordCloud
from collections import Counter
import matplotlib.pyplot as plt
from wordcloud import WordCloud, STOPWORDS

def generate_wordcloud(text):
    wordcloud = WordCloud(background_color ='white',
                          stopwords = None,
                          collocations=False,
                          max_words = 30).generate_from_frequencies(text)
    plt.figure(figsize = (12, 12), facecolor = None)
    plt.imshow(wordcloud, interpolation="bilinear")
    plt.axis("off")
    plt.show()

generate_wordcloud(unique_words)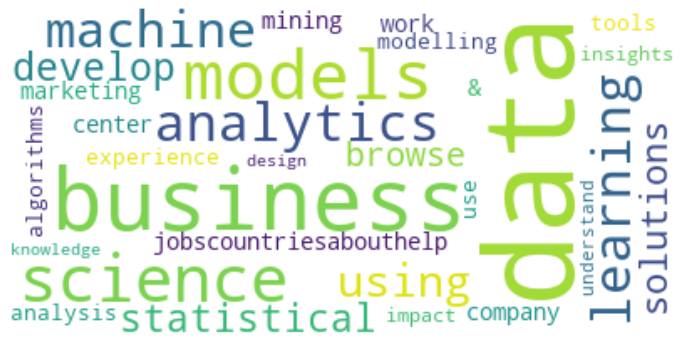
Despite we can extract some useful skills from the word cloud above, most of the words do not represent a skill on its own. For example, the most frequently mentioned words are models and data, which are not meaningful by themselves. What models and what data the companies are asking for? To answer this question, we need to extract the combinations of two words.
from nltk.tokenize import word_tokenize
from nltk.util import bigrams
from nltk.corpus import stopwords
nltk.download('punkt')

# Clean the data
stop_words = stopwords.words('english')
requirements = df_data_scientist['job_desc'].fillna('').apply(str) # convert to string
requirements_token = requirements.str.replace(', ', ' ').str.replace('; ', ' ').str.replace('\n', ' ').str.replace('/', ' ').str.lower().apply(word_tokenize)
requirements_clean = requirements_token.apply(lambda x: [w for w in x if w not in stop_words])
requirements_clean_bigrams = requirements_clean.apply(nltk.bigrams).apply(list)

# Find the most frequent two-word combinations
unique_bigrams = []
counts = []

for element in requirements_clean_bigrams:
    for bigrams in element:
        if bigrams not in unique_bigrams:
            unique_bigrams.append(bigrams)

for unique in unique_bigrams:
    count = 0
    for element in requirements_clean_bigrams:
        for bigrams in element:
            if bigrams == unique:
                count += 1
    counts.append((count, unique))

counts.sort()
counts.reverse()
i = 0
for i in range(30):
    count, word = counts[i]
    print ("%s: %d" %(word, count))
From here, we can extract some meaningful combination of two words (bigram) such as data science, machine learning and data mining etc.
('data', 'science'): 21
('machine', 'learning'): 14
('data', 'mining'): 11
('models', 'algorithms'): 9
('data', 'visualization'): 7
('use', 'data'): 6
('science', 'department'): 6
('marketing', 'data'): 6
('deep', 'learning'): 6
('data', 'sets'): 6
('techniques', '.'): 5
('python', 'r'): 5
('outcomes', '.'): 5
('data', 'sources'): 5
('business', 'problems'): 5
('various', 'data'): 4
('tools', 'monitor'): 4
('statistical', 'analysis'): 4
('processes', 'tools'): 4
('problems', 'using'): 4
('predictive', 'modelling'): 4
('performance', 'data'): 4
('multiple', 'data'): 4
('model', 'performance'): 4
Now, let us go deeper to investigate further into job description text by extracting common data scientist tools and skills required by these companies.
# import TextBlob to perform more investigation into Job Descriptions
import numpy as np
from textblob import TextBlob

!python -m textblob.download_corpora # download textblob basic tools

# make a copy of original data and add new column 'job_description_analysis' for data manipulation.
df_datascience = df_data.copy()
df_datascience.dropna(inplace=True) # dropna() allows the user to drop Rows/Columns with Null values
df_datascience['job_description_analysis'] = df_data['job_desc'].str.lower()
df_datascience['job_description_analysis'] = df_datascience['job_description_analysis'].apply(lambda row: TextBlob(row).words)

# remove irrelevant words from being considered
stop = stopwords.words('english')
additional_stop_words = ['business','new','team','company','equal','opportunity','gender','orientation', 'religion', 'sex', 'national', 'origin', 'sexual', 'identity', 'marital', 'status','race',       'color', 'employee', 'work', 'experience', 'product', 'role', 'organization', 'job', 'description', 'age', 'disability', 'use']
stop.extend(additional_stop_words)
df_datascience['job_description_analysis'] = df_datascience['job_description_analysis'].apply(lambda row: [wd for wd in row if wd not in stop])

# Set up keywords for search

# Educational Levels
degree_dict = {'bs': 1, 'bachelor': 1, 'bachelors': 1, 'undergraduate': 1,
               'master': 2, 'graduate': 2, 'mba': 2,
               'phd': 3, 'ba': 1, 'ma': 2, 'ms': 2, 'msc': 2,
               'postdoctoral': 4, 'postdoc': 4, 'doctorate': 3}

degree_phrases = {'advanced degree': 2, 'ms degree': 2, '4 year degree': 1, 'ph.d': 3, '4-year degree': 1, 'b.s.': 1, 'm.s.': 2, 'm.s': 2, 'b.s': 1, 'ph.d.': 3, 'm.s': 2, 'm.s.': 2, 'master\'s': 2, 'bachelor\'s': 1, 'post-doc': 4, 'post doc': 4}

degree_keywords_set = set(degree_dict.keys())

# Tools Used
tool_keywords = ['airflow', 'angular', 'aws', 'azure', 'bigquery', 'bigtable', 'birt', 'bokeh', #'c', 'caffe',  'cassandra', 'clojure', 'cloud', 'cntk', 'cognos', 'd3', 'dash', 'dask', 'django', 'docker', 'ec2', 'einstein', 'elasticsearch', 'excel', 'firebase', 'flask', 'gcp', 'git',
'github', 'go', 'h20', 'h2o', 'hadoop', 'hana', 'hbase', 'hive', 'java', 'javascript', 'jquery', 'julia', 'jupyter', 'kafka', 'keras', 'kubeflow', 'kubernetes', 'lambda', 'lightgbm', 'linux', 'looker', 'mahout', 'mapreduce', 'mariadb', 'matlab', 'matplotlib', 'mlflow', 'mllib', 'mongodb', 'mxnet',
'mysql', 'net', 'nltk', 'node', 'nodejs', 'nosql', 'numpy', 'oracle', 'pandas', 'pentaho', 'perl', 'php', 'pig', 'plotly', r'pl/sql', 'postgres', 'postgresql', 'postgressql', 'powerbi', 'powerpoint', 'pyspark', 'python', 'pytorch', 'qlik', 'r', 'rapidminer', 'react', 'redshift', 'rpython',
'rstudio', 'ruby', 'rust', 's3', 'sagemaker', 'salesforce', 'sas', 'scala', 'scala', 'scikit', 'scikitlearn', 'scipy', 'seaborn', 'shiny', 'sklearn', 'snowflake', 'solr', 'spacy', 'spark', 'splunk', 'spss', 'sql', 'ssrs', 'swift', 'tableau', 'tensor', 'tensorflow', 'tf', 'theano',
'torch', 't-sql', 'unix', 'unixlinux', 'vba', 'xgboost', 'dplyr', 'ggplot2','esquisse','bioconductor','shiny','lubridate','knitr','mlr','quanteda','dt','rcrawler','caret','rmarkdown', 'leaflet', 'janitor', 'ggvis', 'plotly','rcharts','rbokeh','broom','stringr','magrittr','slidify','rvest',
'rmysql','rsqlite','prophet','glmnet','text2vec','snowballc','quantmod','rstan','swirl','datasciencer']

tool_phrases = ['amazon web services', 'c#', 'c++', 'google cloud', 'microsoft access', 'sql server']

tool_keywords_set = set(tool_keywords).union(set(tool_phrases))

# Skills Required
skill_keywords = set(['ai', 'analyisis', 'anomaly', 'bandit', 'bayes', 'bayesian', 'bi', 'bioinformatics',
 'biostatistics', 'blockchain', 'boosting', 'causality', 'chatbot', 'chi', 'classification',
 'cleaning', 'cleansing','cluster', 'clustering', 'cnn', 'convolutional', 'correlation', 'dashboard',
 'econometrics','etl', 'exploratory', 'forecasting', 'gbm', 'geospatial', 'gis', 'glm', 'graph',
 'hyperparameter','hypothesis', 'kaggle', 'knn', 'knowledge', 'kpi', 'logistic', 'lstm', 'management','mathematics',
 'ml', 'nlp', 'nn',  'normalization', 'ocr','optimization', 'optimizing', 'outlier', 'pca', 'prediction', 'probability', 'recommendations', 'recommender', 'recurrent', 'regression', 'reinforcement', 'research', 'rnn', 'salesforce', 'salesforcecom', 'sdlc', 'segmentation', 'sequencing', 'statistics', 'story', 'storytelling', 'supervised', 'svd', 'svm', 'tuning', 'unsupervised', 'visualization'])

skill_phrases = ['a/b testing', 'ab testing', 'artificial intelligence', 'big data', 'business intelligence', 'chat bot', 'computer science', 'computer vision', 'data mining', 'data science', 'decision tree',
 'deep learning', 'dimensionality reduction', 'domain knowledge', 'experimental design', 'graph theory', 'image analysis', 'k-means clustering', 'machine learning', 'machine vision',  'natural language processing', 'nearest neighbors', 'neural network', 'power bi', 'random forest', 'software development life cycle', 'support vector machine', 'text analytics', 'time series']

skill_keywords_set = set(skill_keywords).union(set(skill_phrases))
Let us do some counting on the number of tools, skills and education on the posted jobs.
# count number of tools, skills and education
def analyze_posts(df):
    tool_list = []
    skill_list = []
    degree_list = []

    num_postings = len(df.index)
    for i in range(num_postings):
        job_desc = df.iloc[i]['job_desc'].lower()
        job_desc_set = df.iloc[i]['job_description_analysis']

        # check if the keywords are in the job description. Look for exact match by token.
        tool_words = tool_keywords_set.intersection(job_desc_set)
        skill_words = skill_keywords_set.intersection(job_desc_set)
        degree_words = degree_keywords_set.intersection(job_desc_set)

        # check if longer keywords (more than one word) are in the job description. Match by substring.
        j = 0
        for tool_phrase in tool_phrases:
            # tool keywords.
            if tool_phrase in job_desc:
                tool_list.append(tool_phrase)
                j += 1

        k = 0
        for skill_phrase in skill_phrases:
            # skill keywords.
            if skill_phrase in job_desc:
                skill_list.append(skill_phrase)
                k += 1

        # search for the minimum education.
        min_education_level = 999
        for degree_word in degree_words:
            level = degree_dict[degree_word]
            min_education_level = min(min_education_level, level)

        for degree_phrase in degree_phrases:
            # longer keywords. Match by substring.
            if degree_phrase in job_desc:
                level = degree_phrases[degree_phrase]
                min_education_level = min(min_education_level, level)

        # label the job descriptions without any tool keywords.
        if len(tool_words) == 0 and j == 0:
            tool_list.append('nothing specified')

        # label the job descriptions without any skill keywords.
        if len(skill_words) == 0 and k == 0:
            skill_list.append('nothing specified')

        # If none of the keywords were found, but the word degree is present, then assume it's a bachelors level.
        if min_education_level > 500:
            if 'degree' in job_desc:
                min_education_level = 1
            else:
                min_education_level = 0

        tool_list += list(tool_words)
        skill_list += list(skill_words)
        degree_list.append(min_education_level)
return tool_list, skill_list, degree_list, num_postings

# get top 20 tools used
def get_topN_tools(tool_list, n=20):
    # create the list of tools.
    df_tool = pd.DataFrame(data={'cnt': tool_list})

    msk = np.logical_or(df_tool['cnt'] == 't-sql', df_tool['cnt']=='pl/sql')
    df_tool.loc[msk, 'cnt'] = 'sql'

    msk = np.logical_or(df_tool['cnt'] == 'scikit', df_tool['cnt'] == 'scikitlearn')
    df_tool.loc[msk,'cnt'] = 'sklearn'

    msk = np.logical_or(df_tool['cnt'] == 'tensor', df_tool['cnt']=='tf')
    df_tool.loc[msk, 'cnt'] = 'tensorflow'

    msk = df_tool['cnt'] == 'amazon web services'
    df_tool.loc[msk, 'cnt'] = 'aws'

    msk = df_tool['cnt'] == 'rstudio'
    df_tool.loc[msk, 'cnt'] = 'r'

    msk = df_tool['cnt'] == 'vba'
    df_tool.loc[msk, 'cnt'] = 'excel'

    msk = df_tool['cnt'] == 'h2o'
    df_tool.loc[msk, 'cnt'] = 'h20'

    msk = df_tool['cnt'] == 'github'
    df_tool.loc[msk, 'cnt'] = 'git'

    msk = df_tool['cnt'] == 'pytorch'
    df_tool.loc[msk, 'cnt'] = 'torch'

    msk = df_tool['cnt'] == 'pyspark'
    df_tool.loc[msk, 'cnt'] = 'spark'

    msk = df_tool['cnt'] == 'gcp'
    df_tool.loc[msk, 'cnt'] = 'google cloud'

    df_tool_topN = df_tool['cnt'].value_counts().reset_index().rename(columns={'index': 'tool'}).iloc[:n]

return df_tool_topN

# gather all tools, skills and education
all_tools, all_skills, all_degrees, all_posts = analyze_posts(df_datascience)
top_20_tools = get_topN_tools(all_tools, 21)

# plot Chart of the Top 20 Tools
from plotly import __version__
from plotly.offline import download_plotlyjs, init_notebook_mode, plot, iplot
import plotly.graph_objs as go

def plot_top_tools(df, post_count):
    layout = dict(
        title='Tools For Data Scientists',
        yaxis=dict(
            title='% of job postings',
            tickformat=',.0%',
        )
    )

    fig = go.Figure(layout=layout)
    fig.add_trace(go.Bar(
        x=df['tool'],
        y=df['cnt']/post_count
    ))

return iplot(fig)

plot_top_tools(top_20_tools, all_posts)
Top 20 Data Scientist tools requirement in Malaysia are:
1	python	16
2	cloud	15
3	sql	14
4	r	13
5	aws	8
6	sas	6
7	google cloud	5
8	oracle	4
9	azure	4
10	javascript	3
11	mongodb	3
12	java	3
13	nosql	3
14	spark	3
15	go	3
16	react	3
17	nodejs	2
18	tableau	2
19	snowflake	2
20	salesforce	2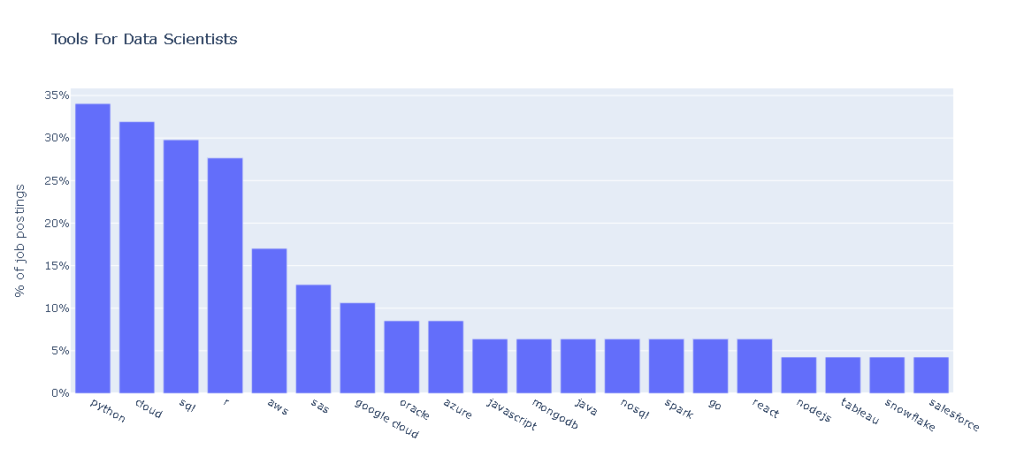
# get the Top 20 Skills
def get_topN_skills(skill_list, n=20):
    # create the list of tools.
    df_skill = pd.DataFrame(data={'cnt': skill_list})

    msk = df_skill['cnt'] == 'ml'
    df_skill.loc[msk, 'cnt'] = 'machine learning'

    msk = df_skill['cnt'] == 'ai'
    df_skill.loc[msk, 'cnt'] = 'artificial intelligence'

    msk = df_skill['cnt'] == 'nlp'
    df_skill.loc[msk, 'cnt'] = 'natural language processing'

    msk = df_skill['cnt'] == 'bi'
    df_skill.loc[msk, 'cnt'] = 'business intelligence'

    df_skill_topN = df_skill['cnt'].value_counts().reset_index().rename(columns={'index': 'skill'}).iloc[:n]

return df_skill_topN

top_skills = get_topN_skills(all_skills, 21)

# plot Chart of the Top 20 Skills
def plot_wanted_skills(df_skill_topN, post_count):
    layout = dict(
        title='Skills For Data Scientists',
        yaxis=dict(
            title='% of job postings',
            tickformat=',.0%',
        )
    )

    fig = go.Figure(layout=layout)
    fig.add_trace(go.Bar(
        x=df_skill_topN['skill'],
        y=df_skill_topN['cnt']/post_count
    ))

    iplot(fig)

plot_wanted_skills(top_skills,all_posts)
Top 20 Data Scientist skills requirement in Malaysia are:
1	knowledge	25
2	machine learning 25
3	data science	22
4	optimization	17
5	management	17
6	research	12
7	big data	12
8	data mining	12
9	business intelligence	10
10	computer science	10
11	statistics	9
12	etl	9
13	visualization	7
14	recommendations	7
15	forecasting	6
16	optimizing	5
17	deep learning	4
18	artificial intelligence	4
19	mathematics	4
20	natural language processing	3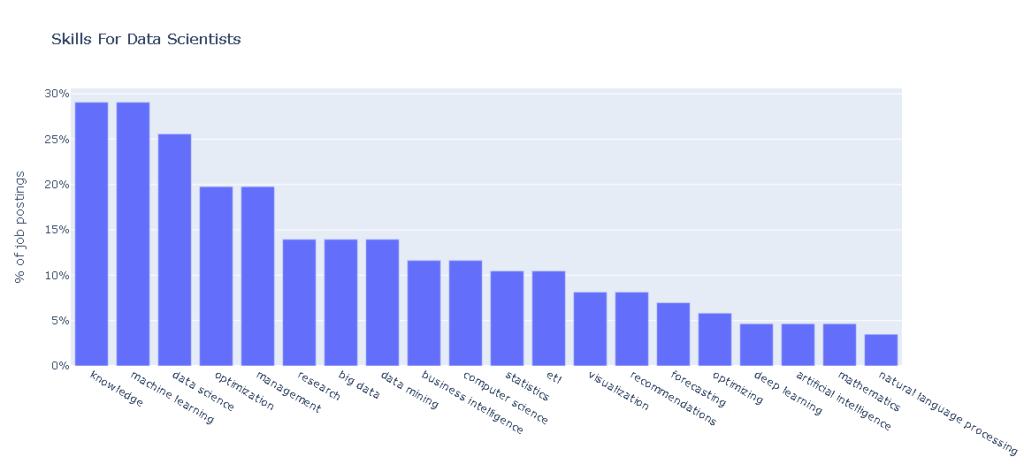
We can find out top locations of these companies using the Pandas data frame filter method. As expected, top cities for data scientist jobs are Kuala Lumpur, Penang and Melaka.
df_data['company_location'].value_counts()

Kuala Lumpur                       101
Petaling Jaya                        8
Penang                               5
Melaka                               4
Subang Jaya                          4
Bangsar South                        3
Butterworth                          3
Kota Damansara                       2
Shah Alam                            2
Batu Caves                           2
Penang Island                        2
Johor Bahru                          2
Seremban                             2
Bukit Jalil                          2
Selangor                             1
Bangsar                              1
Kulai                                1
Kuching                              1
Johor                                1
Brickfields                          1
Kulim                                1
George Town                          1